The Biggest Cause of Flight Delays Is Other Flight Delays
Everyone blames the weather. I analysed 319,395 delayed US flights and weather is 7%. The largest cause is the knock-on from an aircraft that was already late — and the second thing I found was a bug in my own pipeline that raised nothing at all.
Ask anyone in an airport queue why their flight is late and they'll say the weather. I believed it too, right up until I had the filings in front of me.
The US Department of Transportation publishes every domestic flight — scheduled time, actual arrival, carrier — and for anything more than fifteen minutes late, the airline's own attribution of what went wrong. That last part is not a guess. It is filed with the regulator.
I pulled January to March 2024: 1,626,052 flights after cleaning, of which 319,395 arrived late enough to carry a reason.
Weather is 7%.
What the filings say
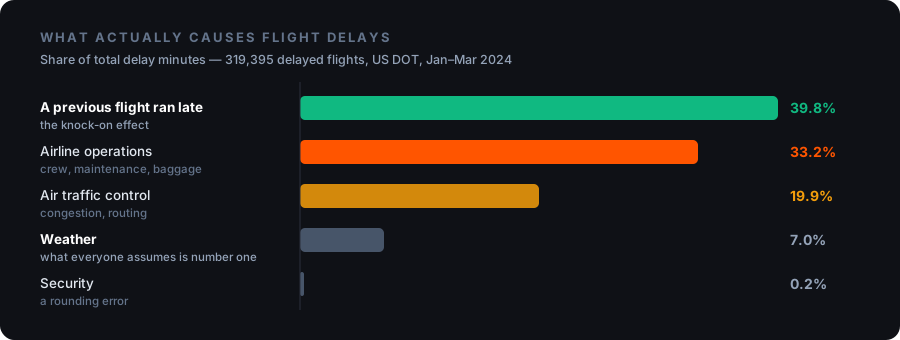
The largest category is late-arriving aircraft — a delay whose only cause is a different delay that already happened.
Nearly two-fifths of all delay minutes in the US system are not caused by weather, or congestion, or anything happening at that airport. They are caused by something else running late, hours earlier, possibly in another city.
Security is 0.2%. It is the thing passengers spend the most time physically queuing for and it contributes almost nothing to flights being late.
Why one delay becomes four
An aircraft does not fly one route and stop. It flies a rotation — four, five, sometimes six legs in a day — and every one of those departures is waiting for the same physical plane.
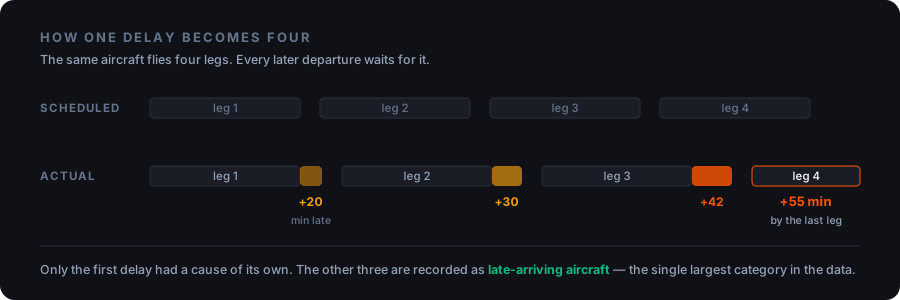
Leg one loses twenty minutes to something real: a slow turnaround, a late catering truck, a genuine weather hold. Legs two, three and four lose time for no reason of their own.
Only the first delay in that chain has a cause worth investigating. The other three are filed as late-arriving aircraft, and they land in the largest bucket in the dataset.
This explains something I had noticed in the model before I understood it. Departure hour is one of the strongest predictors in the whole thing. A 7am departure flies the first leg of the day on an aircraft that slept at the gate. A 7pm departure flies the fifth, on an aircraft that has been accumulating other people's problems since breakfast.
"How late will it be" has no single answer
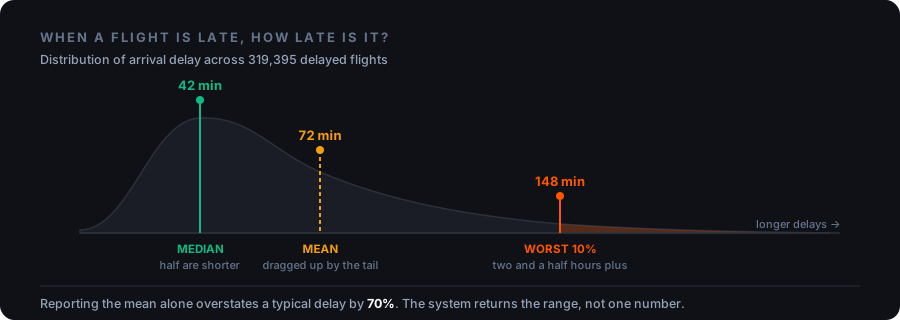
Half of all delays are under 42 minutes. The worst 10% run past two and a half hours, and that tail drags the mean up to 72.
Reporting 72 minutes would be arithmetically correct and practically misleading — it overstates a typical delay by 70%. So the system returns median, mean and 90th percentile together and lets you see the shape.
The constraint that governs everything
Features like "how has this route performed lately" are the useful ones, and they are also
where a delay model quietly cheats. From pipelines/spark_features.py:
w = (
    Window.partitionBy(*partition_cols)
    .orderBy("fl_date")
    .rowsBetween(Window.unboundedPreceding, -1)
)
That -1 is the whole game. The window ends the day before the flight, so a flight's
features can never include its own outcome or anything after it. The same principle governs
the split: chronological, never random. Shuffle flight data and you train on flights that
happened after the ones you test on. It scores beautifully and fails on contact with a real
schedule.
Why 0.672 is the number I trust
The model scores 0.672 AUC, where 1.0 is perfect and 0.5 is a coin flip. That looks mediocre. I think it is the most defensible figure in the project.
This predicts delays before the aircraft has left the gate. It does not know whether the inbound plane is late, whether the crew made it, or what the sky will do in four hours.
There is an easy way to get 0.95 here: let the model see departure delay. A flight that pushed back forty minutes late will land late — that is arithmetic, not prediction. I dropped the column deliberately. If I ever see this model above 0.90 I will assume I have broken something rather than fixed it.
Ranking well and lying anyway
A model can be good at ordering — reliably putting likely delays above unlikely ones — while its actual numbers are nonsense. It says "30% chance" about a set of flights where 45% end up late. The ordering is right; the probability is a lie. That matters the moment anyone makes a decision with it.
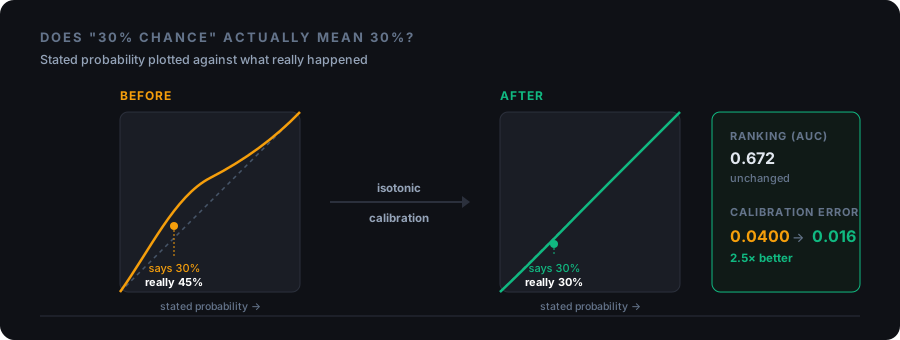
Isotonic calibration cut expected calibration error 2.5×, from 0.0400 to 0.0157, while AUC moved by 0.0001. That is exactly right — calibration does not improve ranking, it makes the numbers mean what they say.
The decision threshold follows the same logic. Most systems flag anything above 50%, which is only correct when both mistakes cost the same. Missing a real delay costs an operations team more than a false alarm — call it 5:1 — so the system minimises expected cost and lands on 17%, catching 77% of real delays. Fifty percent is not a threshold. It is a default nobody questioned.
Where "don't make it up" actually lives
The system takes questions in English, which creates the hardest problem in anything built on a language model: they are excellent at answering questions they cannot answer.
Ask about Emirates. It flies to the US, it sounds like it belongs in a flight dataset, and a model trying to be helpful will find something to say. But BTS covers US reporting carriers only. Emirates is not in there at all, including its US routes.
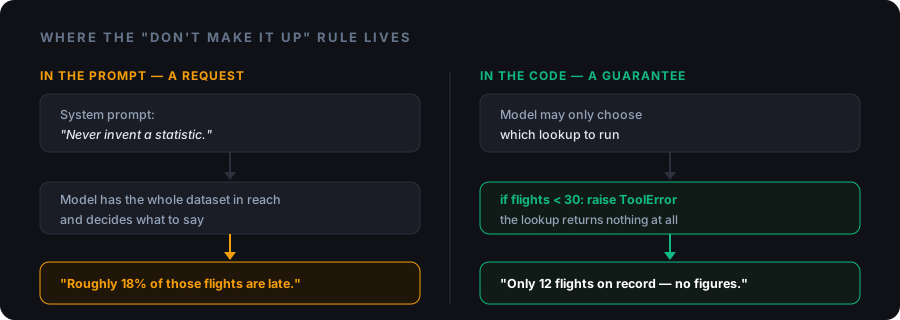
Telling a model "never invent a statistic" is a request. It usually works, and when it does
not you have no way of knowing. So the rule lives in agent/tools.py instead:
raise ToolError(
    f"'{name}' is not in this dataset. It covers US reporting carriers only "
    f"(US Department of Transportation data), so international airlines such "
    f"as Emirates, Qatar Airways or Lufthansa do not appear at all - including "
    f"their US routes. Carriers available: {covered}."
)
The model may choose which lookup to run and how to phrase the result. Every figure in every answer is a return value. Below 30 flights of history the lookup raises rather than returning a number computed from noise. There is nothing for the model to hallucinate because no number was ever produced.
A side effect: most questions have a fixed shape, so a regex router answers route lookups and carrier comparisons straight from the tools at zero tokens. The language model only handles genuinely conversational questions.
The bug that raised nothing
Partway through, every prediction came back identical. Accuracy: 0.500. A coin flip, to three decimal places.
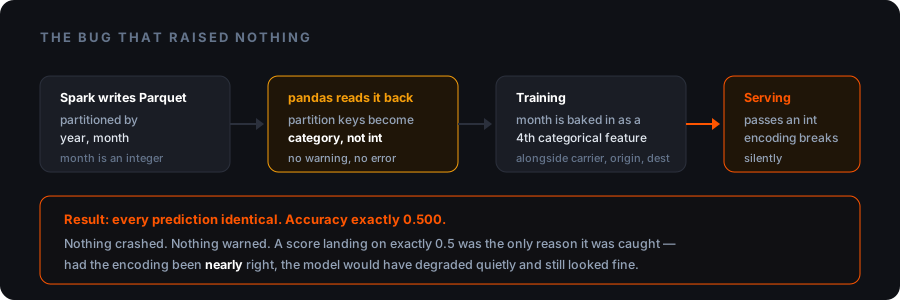
Spark writes output partitioned by year and month. Pandas reads those partition keys back as a
category dtype, not integers. So month — which I intended as a number — was baked in as a
fourth categorical feature beside carrier, origin and destination. At prediction time it
arrived as a plain integer, the signature no longer matched, and LightGBM stopped
distinguishing between inputs.
Nothing crashed. Nothing warned.
The score landing on exactly 0.5 is the only reason I caught it. Had the encoding been nearly right instead of completely wrong, the model would have degraded to 0.61 and looked entirely plausible. I would have shipped it.
The fix was routing training and serving through one loader, ml/feature_store.py, so the two
cannot disagree about dtypes. The lesson is the class of bug, not the fix. The dangerous
failures in data work are not the ones that throw; they are the ones that return something
reasonable. Same shape as the filter bug I found in
qdrant-client, and as tenant isolation in
RAG. Silence is not safety.
What this does not solve
- Weather features are wired but empty. The NOAA join exists and the columns are there; I have not pulled the extract. At 7% of delay minutes it is lower priority than it sounds.
- No duration prediction. The model predicts whether a flight is late, not by how many minutes. That is a regression problem and a second model.
- US domestic only. There is no free international equivalent; most countries do not publish this at all.
- Three months of data, so the rolling features are thin in early January.
Run this on your own model today
- Print your training and serving dtypes side by side and diff them. If a column disagrees, you have this bug and no exception will tell you.
- Check whether any metric has landed on a suspiciously round number. 0.500, 1.000 and 0.000 are bug signatures, not results.
- Find every rolling or aggregate feature and confirm the window ends before the row it
describes. Look for the
-1. - Confirm your split is chronological. If you called
train_test_splitwithshuffle=Trueon time-series data, your metrics are fiction. - Plot a reliability curve, not just AUC. Good ranking with bad probabilities is the failure nobody checks for.
- Ask where your threshold came from. If the answer is 0.5, price the two errors and recompute it.
Code, metrics and the full list of bugs are at github.com/nazsats/flight-delay-intelligence. The data is public-domain US DOT on-time performance — flights, not passengers, so there is nothing personal in it.